In the aftermath of COP26, and now with Russian invasion of Ukraine forcing a major re-evaluation of priorities, the future of the fossil fuel industry is coming under intense scrutiny from all sides. Since the first well was drilled in 1848, oil and gas have become the driving force of the world economy. But this era must now rapidly come to an end if the 1.5oC net zero emissions world depicted in scenarios is to become reality. The latest net zero scenarios clearly show that the sector is of critical importance in meeting global climate goals and in managing the remaining carbon emissions budget. Fossil oil and gas production will have to be phased down and closed within a few decades.
Measuring alignment with climate change goals in the fossil fuel sector is in many ways simply about just that: measuring whether companies are phasing down and closing production. 2° Investing Initiative’s Paris Agreement Capital Transition Assessment (PACTA) tool currently enables the measurement of whether fossil fuel producers are phasing down their production at the same rate as a chosen scenario. This is a simple and scientific way of measuring alignment, comparing for example barrels of oil produced by oil companies to how many barrels of oil the scenarios anticipate can still be taken out of the ground.
However, our work in 2020 with the Katowice Banks (BBVA, BNP Paribas, ING, Société Générale and Standard Chartered), as well as recent new proposals for measuring the alignment of the sector by amongst others the Taskforce on Climate-related Financial Disclosures (TCFD) and Science-Based Targets initiative (SBTi), suggests that just measuring production phase down will not be enough. Other factors have also now come into focus, such as whether alignment might mean that production assets have simply been divested and sold, or how an investor can determine whether a producer may in the future be a winner or loser in the new market for clean energy.
Put differently, there seems to be a gap in our foresight in terms of what role these companies will play, if any, in charting course to a net zero energy economy. While the sector itself needs to disappear, the companies within the sector may be able to play a significant role in building the new clean energy economy. For financial institutions to assess their alignment with the Paris Agreement in relation to their fossil fuel exposures, much greater visibility is required on the contribution major producers will make to building the new energy economy and, importantly, what will happen to their legacy fossil fuel assets along the way.
There is also a major financial imperative to close our foresight gap because the major fossil fuel producers are in effect everyone’s business. This is because they are present in every major index used by investors. They therefore contribute to mainstream investment returns and pension fund performance. It is therefore imperative that banks and institutional investors better understand the future risks and opportunities associated with the sector, as well as exercising consistency in their actions and demonstrating active stewardship of assets in the sector.
In short, new metrics may be needed that provide symmetric, decision-useful information for banks and investors to drive the transition and understand whether phase down and clean energy investment is happening in the real economy.
With this in mind, we decided to carry out some preliminary research in order to get a snapshot of the industry from an energy transition perspective. With our focus on upstream oil and gas production, we set out to answer the following questions:
- What are the prospects for the net zero targets and commitments of upstream oil and gas producers to be translated into real change and investment?
- How do the current production plans of these producers square up with their public commitments to net zero targets and to a managed transition?
- What metrics may be needed to measure and track meaningful progress made by producers, as well as to select those with the best prospects for the future?
In order to start to answer these questions, we measured the 5-year forward looking alignment for a cross section of upstream producers using the PACTA methodology and company-level production forecasts from our data provider Asset Resolution. We then cross checked our alignment findings with recent sectoral analysis by Carbon Tracker Initiative and the Transition Pathway Initiative. To understand the context and the challenges facing the sector we also made an initial review of selected scientific and commercial literature.
The preliminary answers to these questions are contained in the discussion paper that accompanies this blog. In seeking to answer the questions posed we have considered what PACTA’s current alignment metrics can and cannot tell us about the sector’s transition, as well as why we may need new metrics and what else we may need to pay attention to in seeking to develop new metrics. We have also become aware of a number of major dilemmas that the industry, as well as their investors and financiers, faces going forward and we have used these to further frame our research.
Three main overall conclusions have emerged, which we briefly outline below. Although more work is needed, we can already start to point to the need for new metrics and also where most attention should be focussed:
- Keep an eye on what’s happening short term
Long-term commitments to net zero and scope 3 emissions reductions need to be backed up by evidence that real change and investment has been initiated.
The results from our alignment measurement of a selection of upstream oil & gas majors, independents, international and national producers against the IEA’s Net Zero by 2050 scenario are telling. On a 5-year time horizon, the production forecasts suggest that:
- the EU majors who have set ambitious net zero and scope 3 emissions targets and are rated strongly on transition management are, for the most part, anticipated to maintain or increase oil and gas production in the coming 5 years which is not compatible with any 1.5oC net-zero scenario (see figure 1);
- the North American majors and independent producers who have been slower to set net zero targets, address transition at management level and mainly focus on scope 1 and 2 emissons interestingly show a decline in production planned for the coming 5 years (see figure 2);
- national producers and their international ventures show plans to significantly increase production and there is as yet, limited evidence that this will be curtailed by transition considerations (see figure 3).
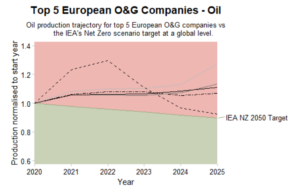
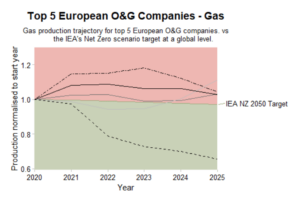
Figure 1. Production trajectory alignment for the top 5 EU majors 2020 – 2025
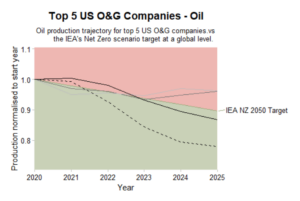
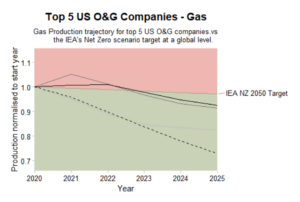
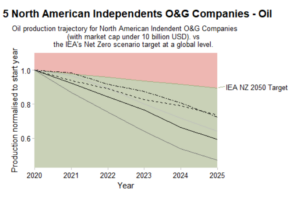
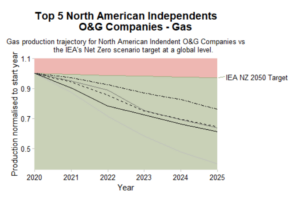
Figure 2. Production trajectory alignment for the top 5 North American majors and top 5 independents 2020 – 2025
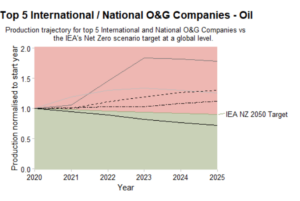
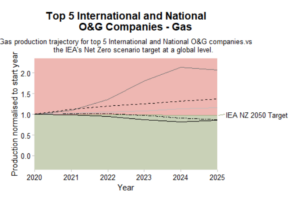
Figure 3. Production trajectory alignment for national/international producers 2020 – 2025
At first the results appear to be counterintuitive, but after consulting with some industry experts we learned that EU majors tend to invest in more capital-intensive projects that have longer lead times – such as offshore wells. This means that to understand if their production is set to decline in-line with their near-term (2030) climate change commitments, we should consider extending the time frame for alignment measurement from 5 to 10 years.
The opposite is true for the North American majors and also for independent producers. They tend to invest in production assets with shorter term prospects and which decline more quickly – such as shale gas. Hence, we need to watch our 5-year forecasts carefully as their production may just as quickly ramp-up again post Covid-19.
The national producers are a separate case in point. Their strategic motivations are longer term and driven by national economic interests. They do in part, however, rely on major producers to raise the capital to exploit reserves and sell the product. They are still therefore at the behest of the capital markets.
Overall, the results underscore the need for analysts to look beyond just the targets set by companies and to compare them with their planned investment on a 5-10 year timeframe. It is also important to take into account technology and investment lead-times.
Possible metrics:
- Continue with measurement of exposure to oil and gas production based on comparison of volume trajectories with scenarios depicting achievement of a 1.5oC/net zero climate goal.
- Extend the timescale for measurement to 2030 in order to capture the wind down of longer-term investments
- Disaggregate production by different types of oil and gas reserves and production technologies, as each have distinct investment lead times, economic life spans and breakeven prices.
- Ensure that the phase down is a real part of transition
Attention is needed on final investment decisions for new production that are incompatible with climate scenarios and also on how alignment is being achieved in practice.
In terms of new production, the IEA in their Net Zero by 2050 scenario have already signalled that any new development of upstream extraction committed on from 2021 onwards will be incompatible with keeping global warming below 1.5oC. This establishes a clear cut off point for phasing down existing production commitments. Linked to this cut-off are the sources of financing and refinancing used to continue with new exploration and extraction.
On the legacy side, there are already signs that under pressure to reduce their CO2 emissions, improve net zero alignment and fund their transition, large producers with net zero targets such as Shell and BP are selling-off oil and gas assets to producers that have been slower to accept the need for transition, such as for example Conoco-Philips. This underscores the need to understand how improvements in climate performance are being achieved, both at company and portfolio level. Is an alignment improvement, for example, the result of a real phase down of production capacity or has production capacity simply been sold to another company or, as in some recent cases, to hedge and private equity funds. The term ‘responsible retirement’ is now being used.
Both of these areas of decision-making and activity therefore require careful tracking in order to understand whether producers are addressing the need for a phase down.
Possible metrics:
- A simple distinction between compatible and non-compatible production, as well as associated capex and financing, could be a starting point.
- The tracking of the sale, phase down or closure of legacy production assets, in order to detect whether production is being retired responsibly or is simply being sold in order to meet targets and improve alignment.
- Measurement of new corporate lending and debt security issuance (bonds or hybrid bonds are used extensively) earmarked to finance non-compatible production.
- Identifying the potential winners and losers
Understanding and reporting on credible signs of transition, in terms of both actions and the leveraging of capabilities, will become increasingly important in conditioning finance and investment.
Both the fossil fuel producers and the financial sector face major dilemmas in seeking to make the transition to a low carbon, clean energy economy. Moreover, measuring transition is made more difficult for this sector because of the wide diversity of clean energy-related activities into which companies could diversify.
On the one hand, producers claim the need to continue to generate cash from fossil fuel assets in order to finance new clean technology investments, whilst at the same time maintaining shareholder confidence in the viability of their plans – the so called ‘trilemma’.
On the other hand, the financial sector needs to have confidence in the plans of the producers to phase down and diversify, otherwise they might choose to reallocate their capital to new players. Having the right information in order to make decisions will therefore be critical.
The winners from the transition will be those producers that are able to manage this trilemma by leveraging their assets, knowledge and capabilities, and ultimately by finding their niche in the new clean energy economy. Whilst there are already examples of tangible investment in clean energy, their limited scale means that it is not yet clear what the indicators of success are. The onus is therefore on the financial sector to better understand what credible signs of transition they should be looking for and to signal this to producers as conditions for financing the transition.
Possible metrics:
- The split of capex assignment to fossil fuel production, ‘climate solutions’ and, for completeness, other non-climate related diversification activities,
- The revenue split between fossil fuel production and ‘climate solutions’ i.e. activities that are compatible with a 1.5oC scenario and those that will not. The latter could be defined by reference to a taxonomy of economic activities contributing to climate change mitigation.
- The total primary energy substitution of fossil fuel inputs to the economy with clean, renewable energy inputs measured across a company’s energy production portfolio.
- Tracking of successful outcomes from engagement with producers in which assets are held, with a focus on changes in their alignment and transition status.
These initial conclusions are the result of our first scan of the sector over the last few months. They will each need further discussing and testing with stakeholders in order to diagnose and understand how we can improve upon current metrics.
And this is exactly what we plan to do in 2022. This blog and discussion paper serve as a scene setter for further work during this year to develop a new set of fossil fuel metrics for PACTA. This month we started a new study the first output from which will be a white paper this summer evaluating possible new metrics. This will be followed in autumn by a process of road testing, running to the end of the year and involving up to 5-6 banks. We will also establish a working group of experts on the sector to steer and input into the work. The outcome of this process will be a new set of metrics, a toolkit and accompanying guidance to be first introduced into PACTA for Banks.
For more information, please contact the PACTA team at transitionmonitor at 2degrees-investing.org.
